Revolut · LLM Ops
Online model evaluation
The evaluation flow AI teams use to A/B language models against live traffic — and ship the winners with confidence, not gut feel.
- Role
- Product designer — end-to-end
- Timeline
- 2025
- Platform
- AI Ops Platform
- Company
- Revolut
Impact
−0%
Rollout time
14 → 4–5 days
+0pp
Task success
52% → 61%
0→65%
Team adoption
−0%
Inference cost
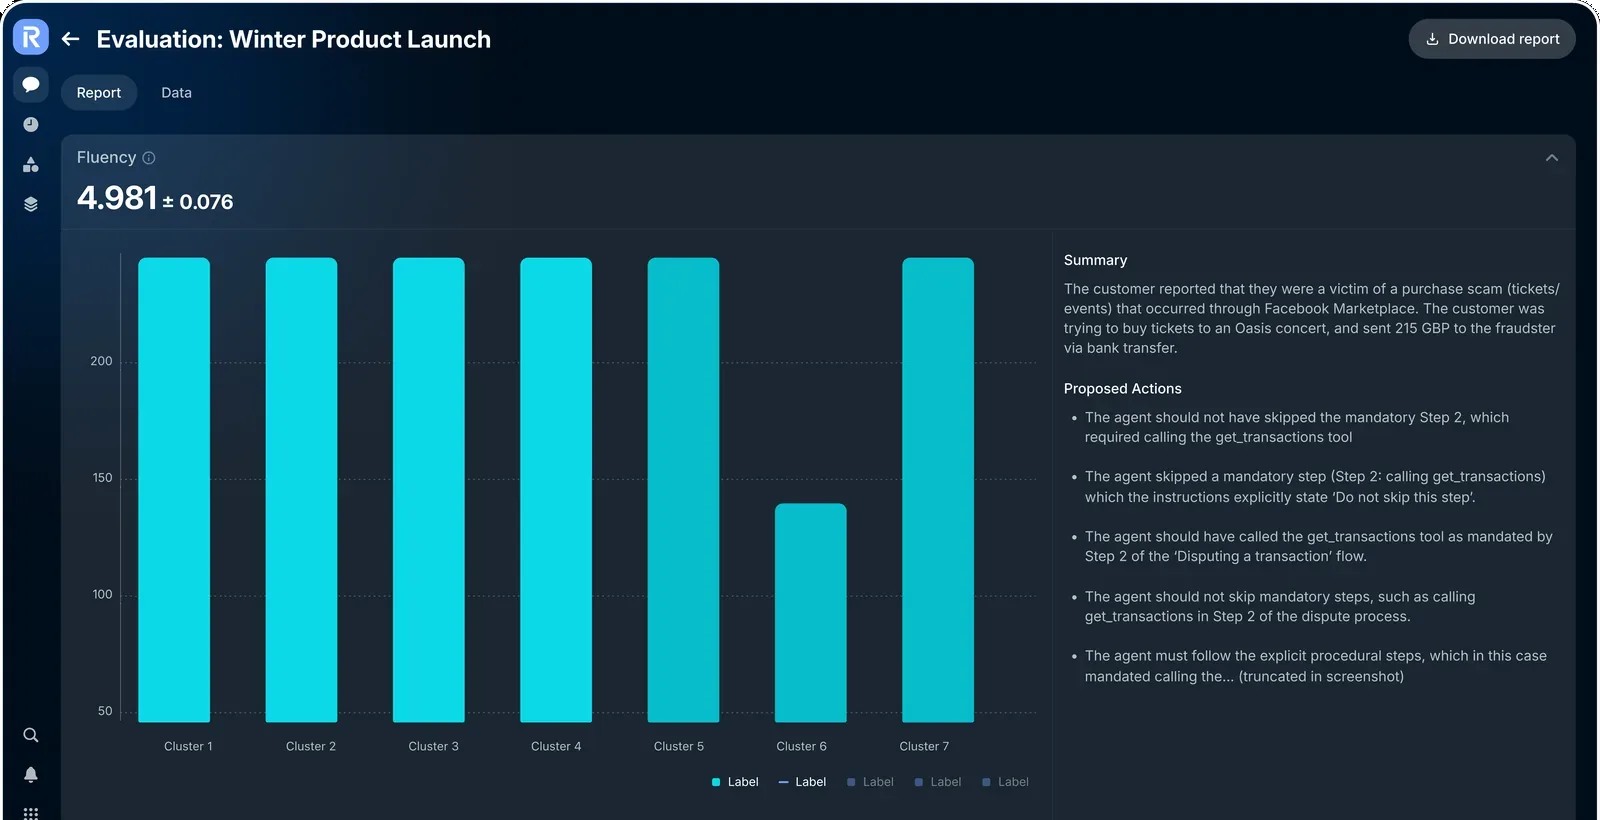
The evaluation report — per-metric clusters, a written summary, and proposed actions for the run.
Context
Revolut needed to safely roll out better-performing models to production without risking customer experience or spiralling inference costs. The constraints were unforgiving — high live traffic, strict latency targets, cost sensitivity, and compliance rules for user data.
A regression could dent NPS or spike support costs, so every experiment had to be reversible and auditable. The goal: a low-friction online-evaluation flow that lets teams A/B models against real traffic and decide rollout with confidence.
The problem
Teams were shipping model changes on gut feel. There was no low-friction way to compare a candidate model against the incumbent on live traffic, watch the metrics that mattered, and roll back the moment it regressed.
Setup was manual, results lived in scattered notebooks, and go/no-go calls dragged on for two weeks.
Model changes were a leap of faith — expensive to make and impossible to unwind.
My contributions
Service mapping
Mapped the end-to-end evaluation lifecycle — Setup → Trace sampling → Evaluation metrics → Report — so every team spoke the same language.
Strategy & alignment
Aligned ML engineers, POs, PMs, support ops and compliance around one auditable flow.
Interaction & UI
Designed the Experiment Setup Wizard, Traffic Split control, real-time Comparison Dashboard, and Result Summary.
Benchmarking & critique
Benchmarked comparable eval tooling to set the bar, and ran critique sessions to pressure-test the solution.
Handoff
Shipped specs and design-system components so engineering could build without guesswork.
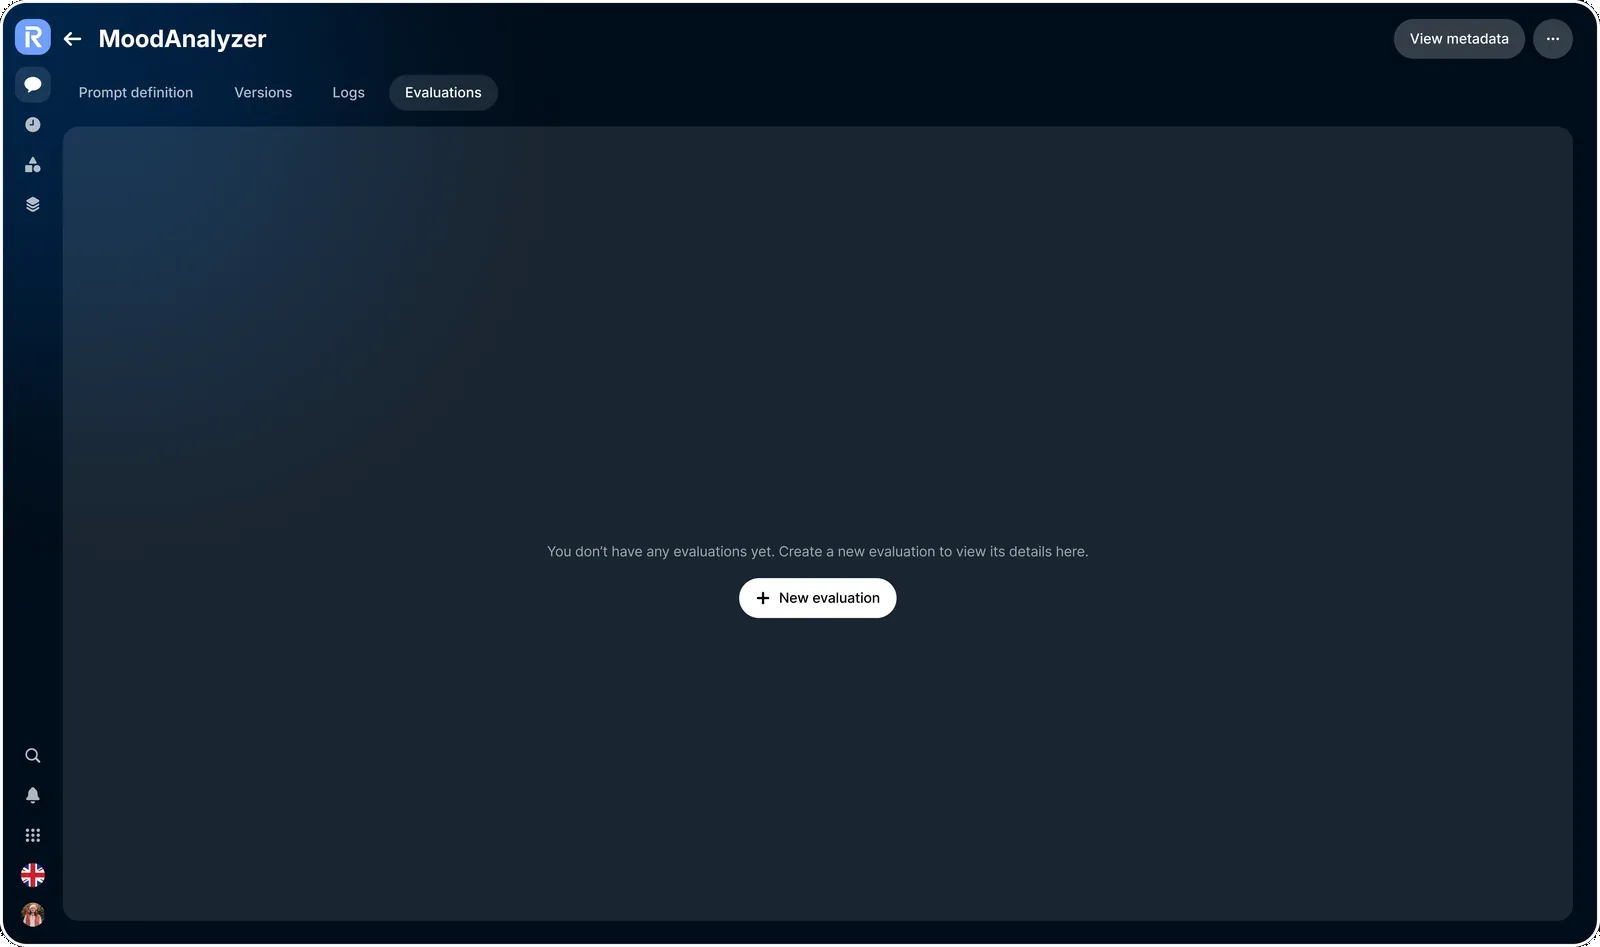
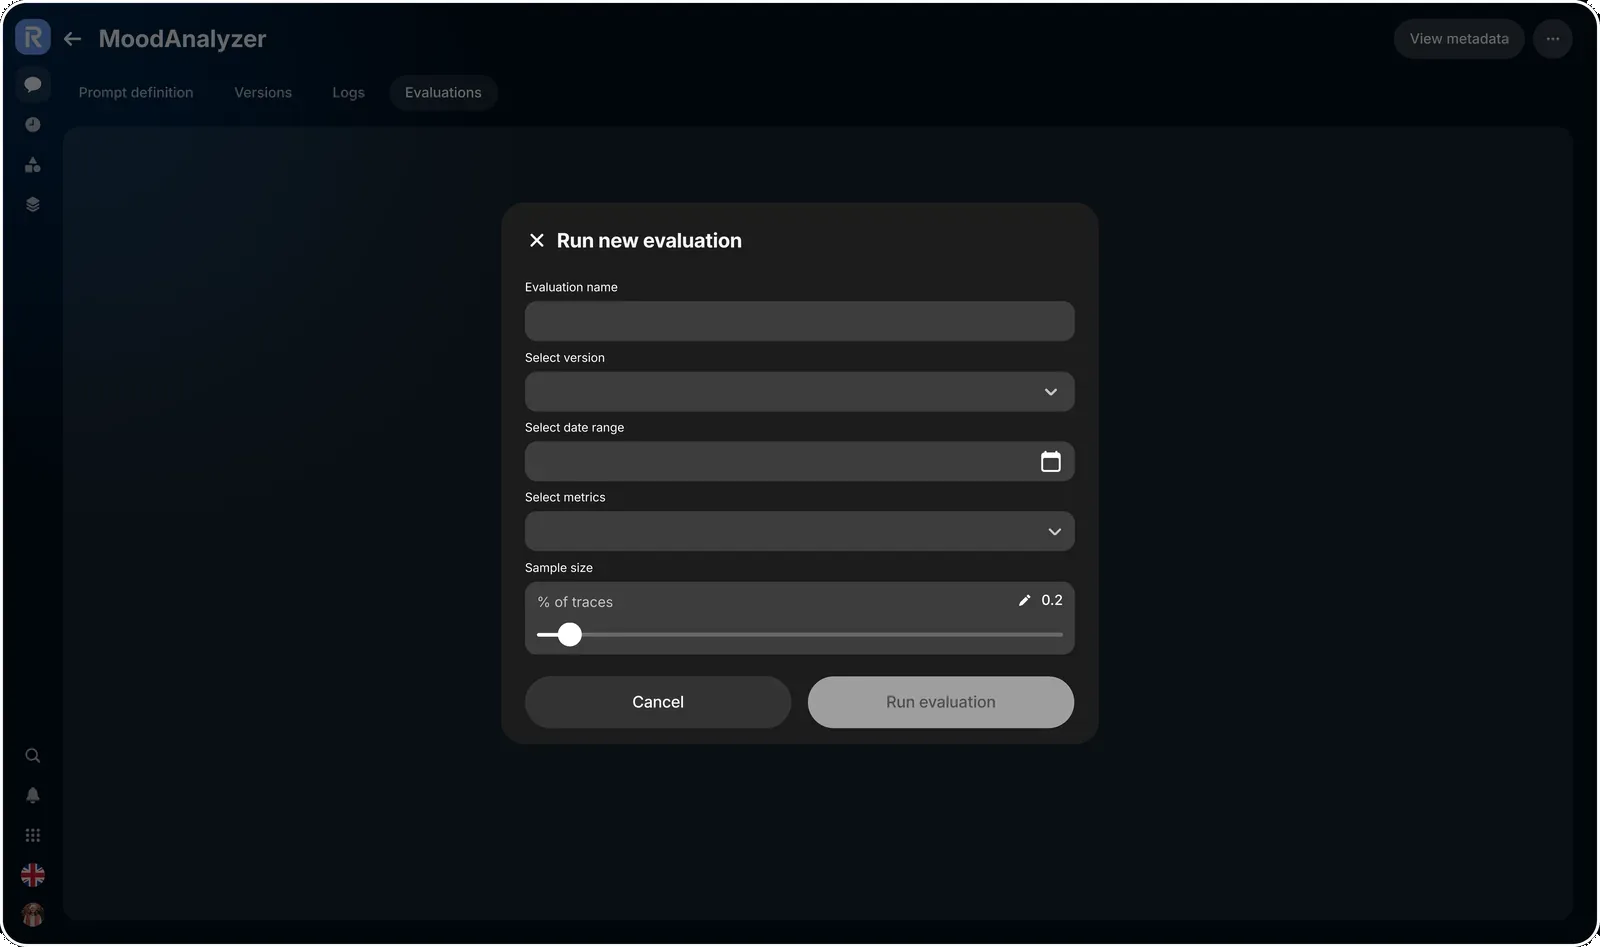
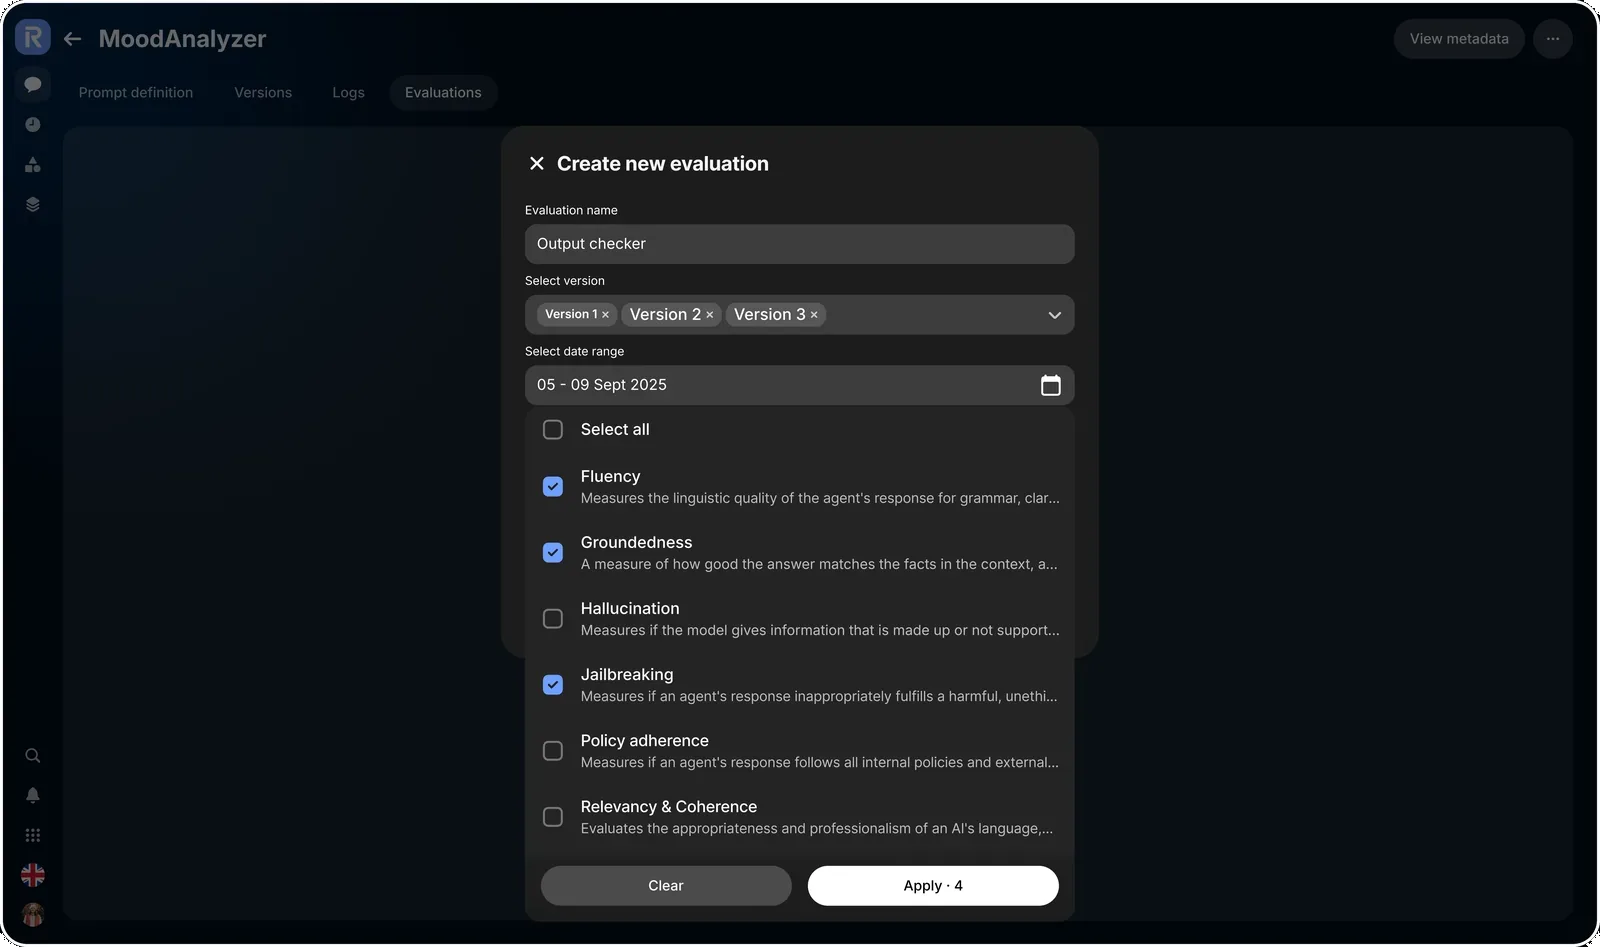
Set up an experiment in minutes
Guided defaults — sample size, minimum confidence, KPI targets — and templates for common evaluations, so a rollout is a few clicks, not a config file.
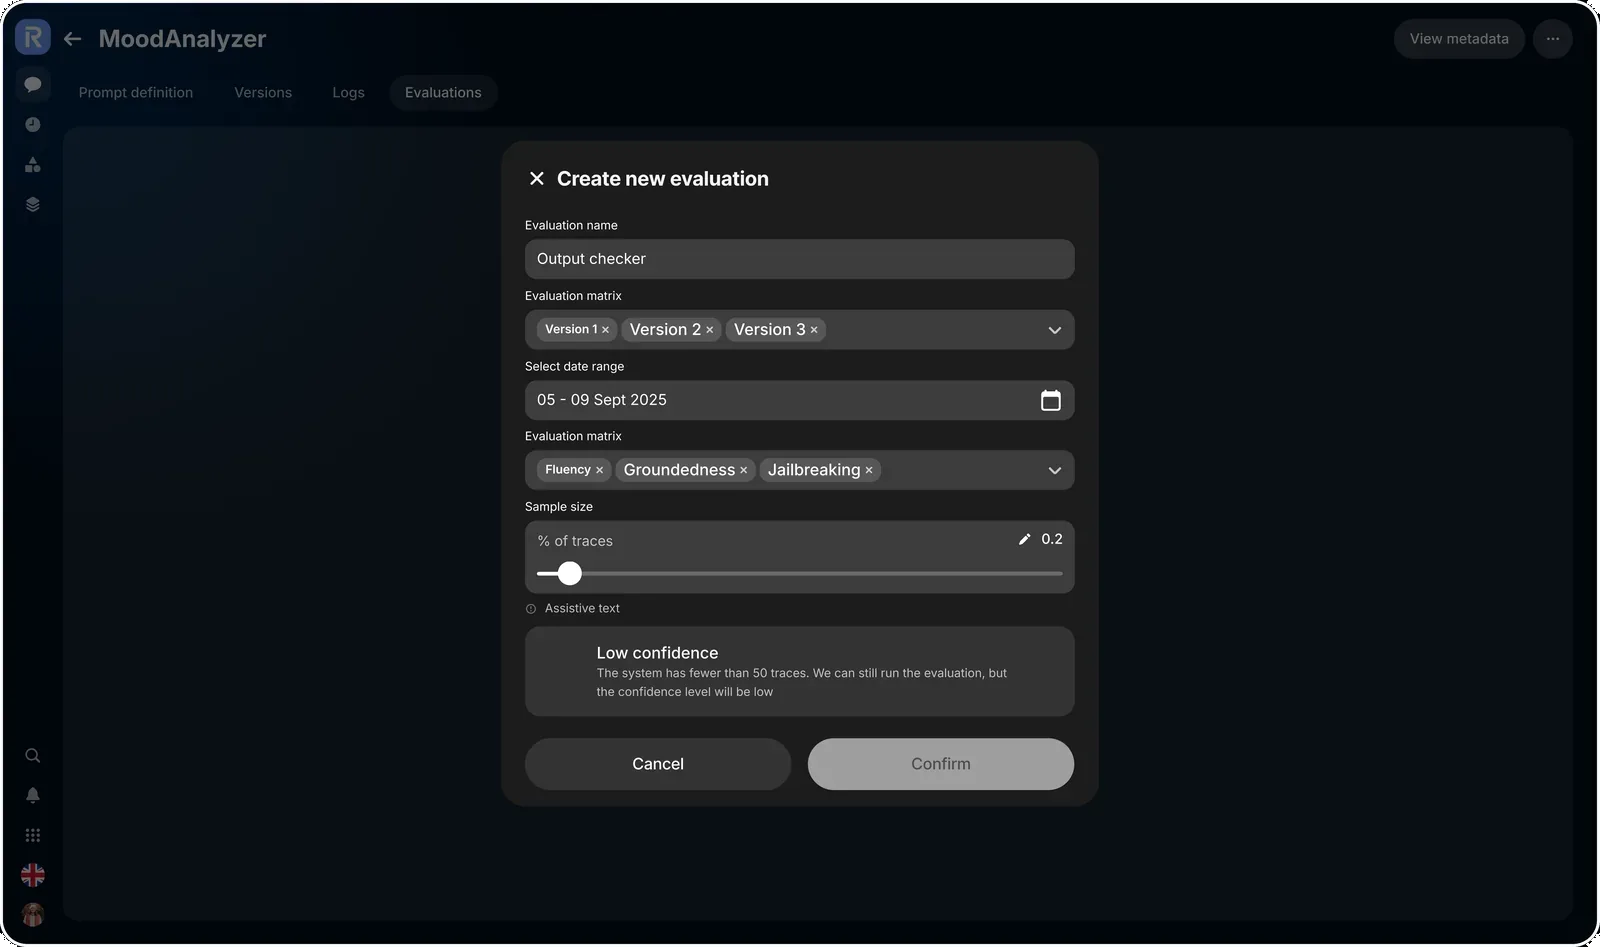
Score every trace against every metric
The data view scores every trace across every metric — fluency, groundedness, hallucination, jailbreaking, policy adherence, relevancy, safety — sortable and filterable, and safe to roll back.
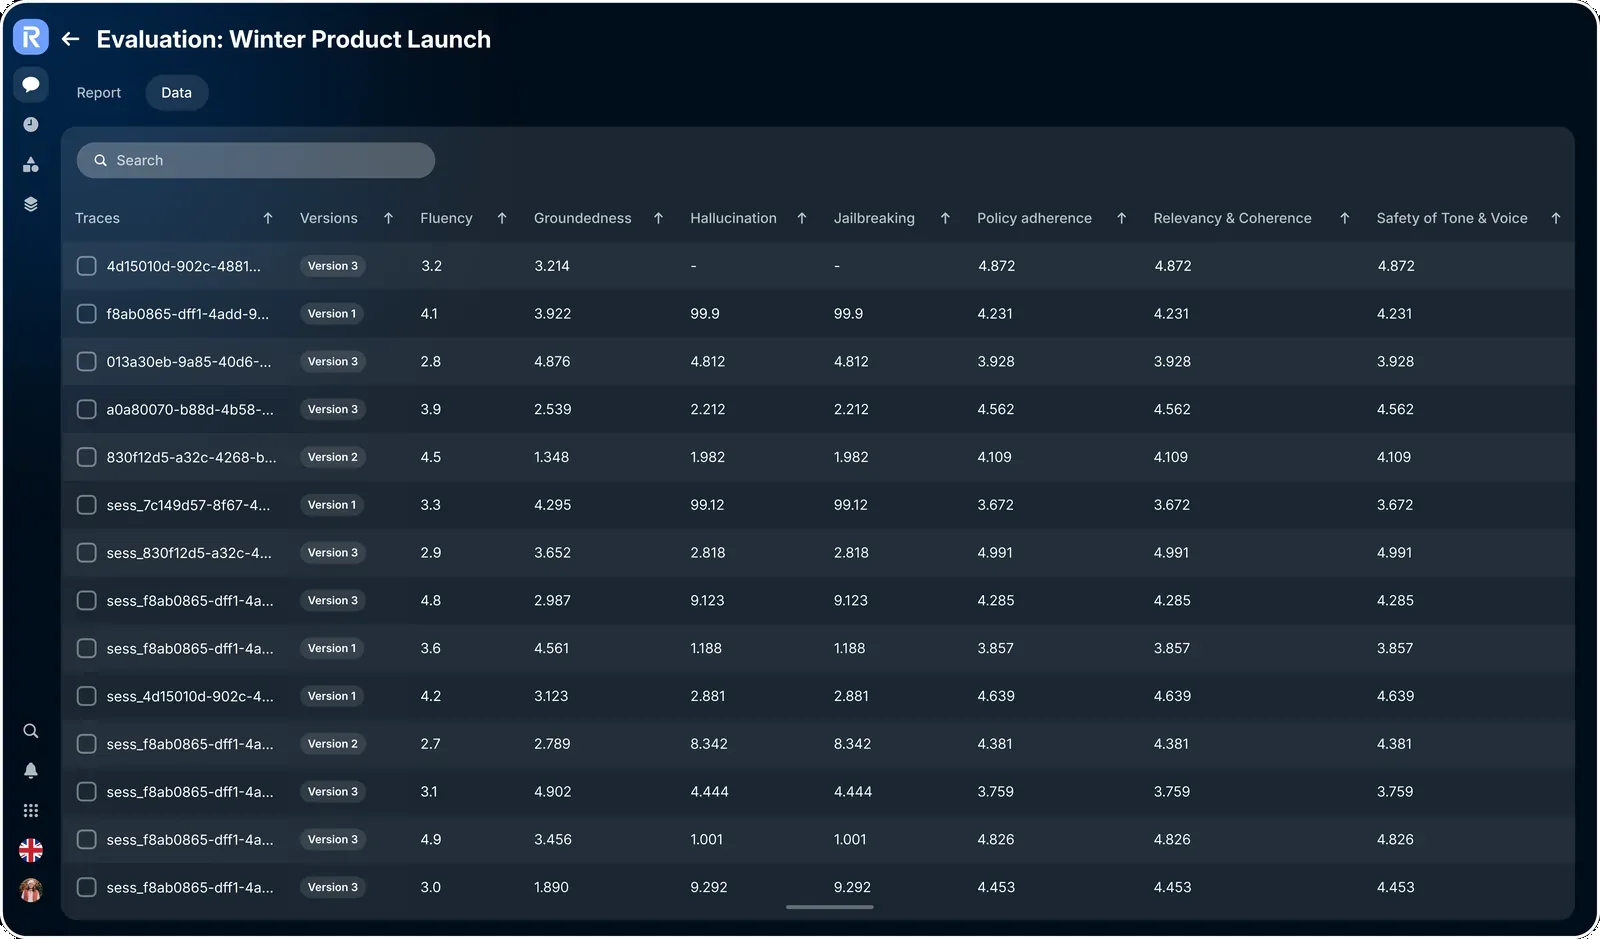
The data view — every trace scored across every metric, sortable and filterable.
Drill into any trace
Open a trace to read the model’s actual response, its per-metric scores, and a written summary with proposed actions — so a bad number always leads to a concrete fix.
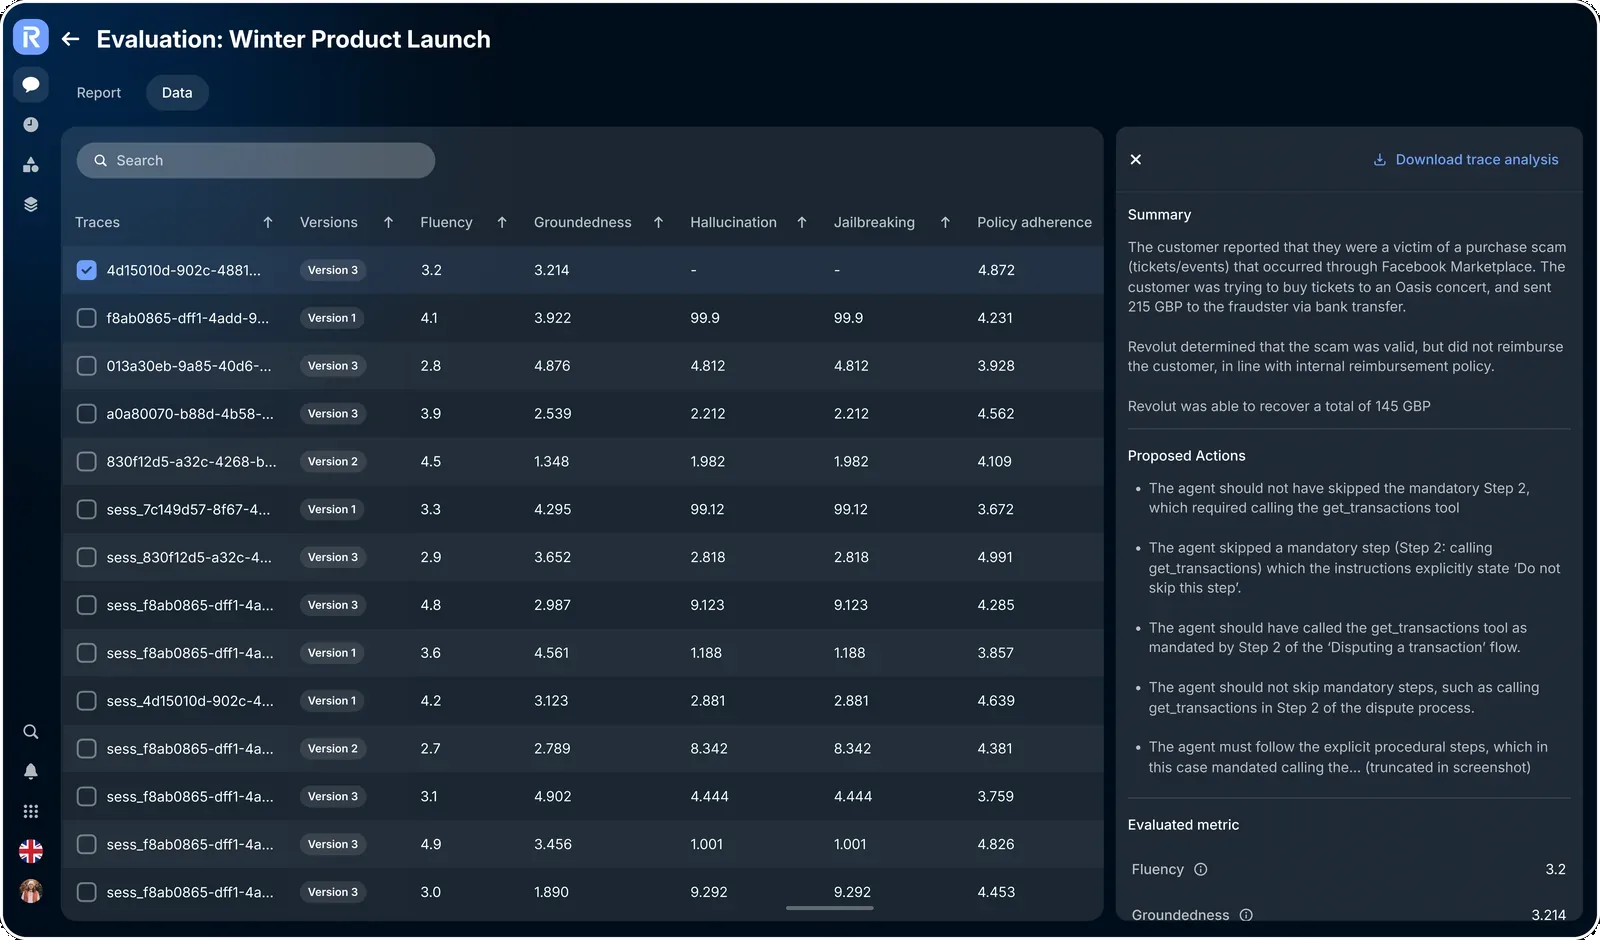
The trace-level report — scores, a summary, and proposed actions for a single response.
Outcomes & impact
Model rollout time
Down about 60% — from ~14 days to 4–6 days median.
Production win rate
Teams could measure model improvements reliably; production-winning models lifted task success by ~9 percentage points.
Decision confidence
Product owners reported clearer, faster go/no-go decisions.
Adoption
Grew significantly across product teams after the pilot — from 25% to 65%.
Before / after
| KPI | Before | After | Change |
|---|---|---|---|
| Time to deploy · median rollout | 14 days | 4–5 days | −60% |
| Production task success · primary KPI | 52% | 61% | +9 pp |
| Median latency · response time | 420 ms | 370 ms | −50 ms |
| Inference cost · per 1k requests | $12.00 | $10.20 | −15% |
| User satisfaction · CSAT for AI responses | 72% | 80% | +8 pp |
| Failure / error-trigger rate | 8.0% | 5.2% | −35% |
| Adoption · teams using online-eval | 25% | 65% | +40 pp |
From the internal KPI snapshot across the pilot — absolute (pp) and relative changes where useful.
“Online evaluation moved model decisions from guesswork and offline proxies to real production signals — meaning faster, safer rollouts, lower cost from weak models, and the confidence to experiment. All key to scaling AI across Revolut’s product lines.”